
Two days ago, I wrote about a number of trends underlying venture capital deals the last few years. The short version:
- The number of deals is down, while capital invested is up, which means the average deal size has increased
- Looking at the underlying data shows a widening dispersion of deal sizes within round sequences, and the drivers of that variation differed across the rounds.
- These trends were strongest in earlier rounds, and for that segment of the market, was generally driven by some very large deals at the top (though, deal sizes across the distribution within rounds has been up overall).
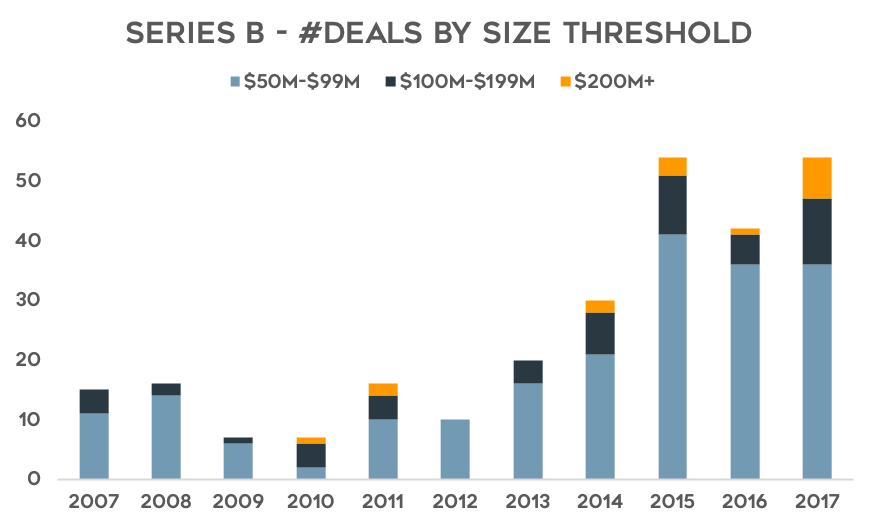
Today, I thought I'd go ahead and plot those deals. The charts below show the number of deals at the high end of three funding rounds (Seed, Series A, and Series B) between 2007 and 2017. It shows just how much bigger some of the largest deals within these round sequences has gotten.


That's it... a short post for once.