
Earlier today, I saw a post from Seth Levine that showed average venture capital deal sizes increasing across the round sequences. I wanted to find out what is driving these trends, so I dug deeper into the data (if you want the quick version, skim the charts and tables below and see my main takeaways bulleted at the bottom of the post.)
To begin, here's a quick recap of what's happening in funding rounds at the aggregate:
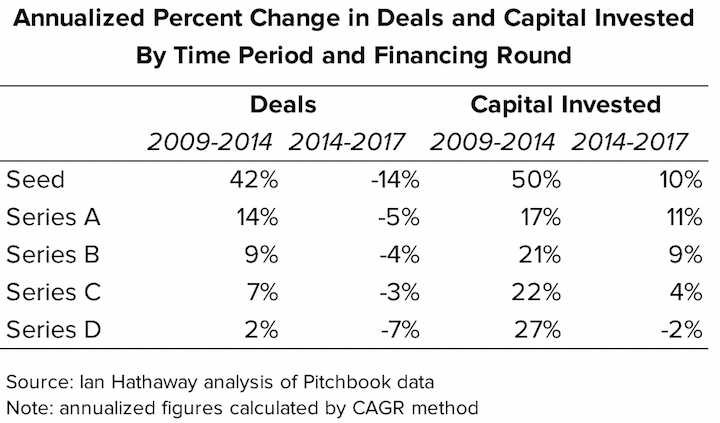
- Seed: deals are down sharply and capital invested up sharply. Deals have fallen 36 percent since 2014 and capital invested is up by 33 percent at the seed stage.
- Series A + B: deals are down moderately and capital invested up sharply. For Series A, deals are down by -15 percent from 2014 and capital invested is up 36 percent. For Series B, those same figures are -11 percent for deals and 30 percent for capital invested.
- Series C: deals are down moderately and capital invested up moderately. Deals are down by 8 percent from 2014 and capital invested is up 13 percent.
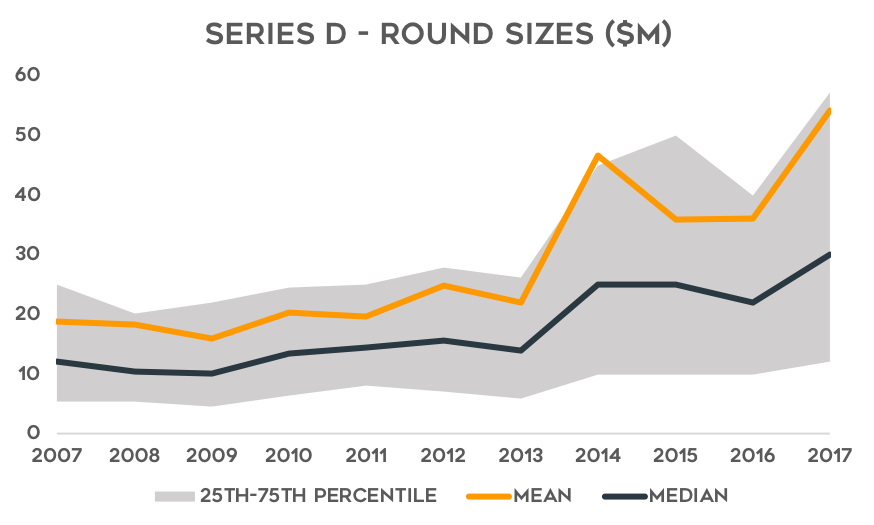
- Series D: deals are down moderately and capital invested is down slightly. Deals are down by 19 percent and capital invested is down by 5 percent.

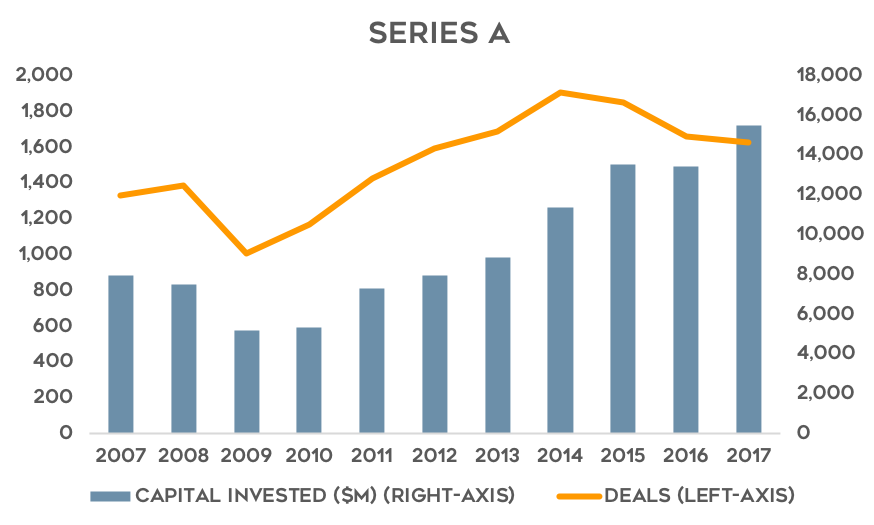
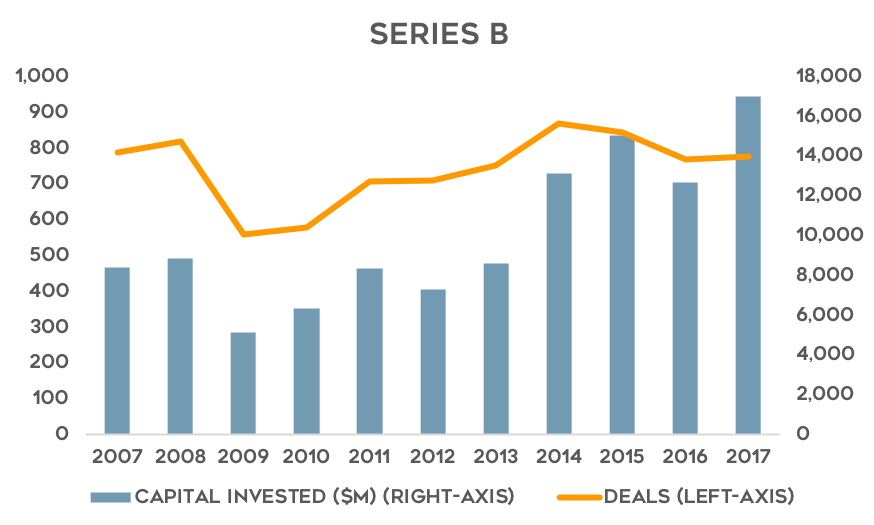

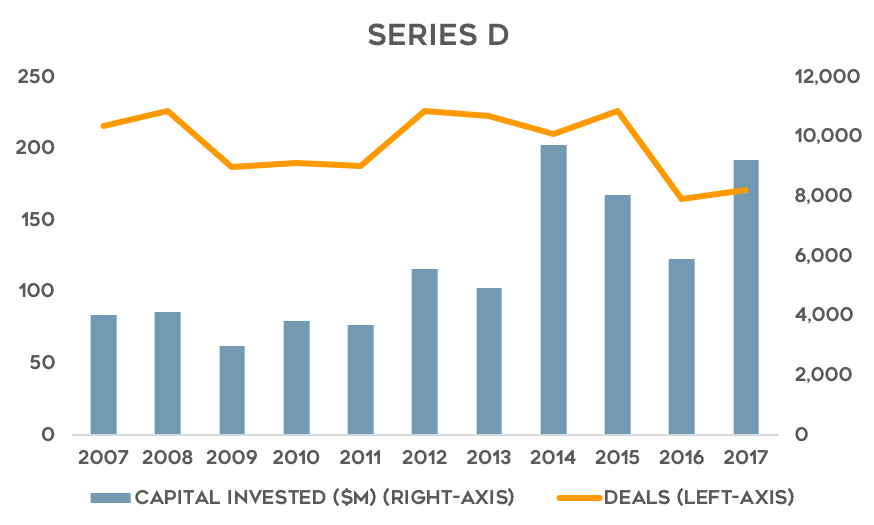
A very clear trend is occurring—deals across all stages are down and yet capital invested is up (the exception is Series D, where both declined but capital invested fell less sharply than did deals). This implies, of course, that deal sizes are going up as fewer companies receive investments and more capital is being deployed. The data also make clear that the increases in average deal size are most pronounced at the earliest stages.
But, looking at averages alone can give an incomplete picture of what's really happening. As I wrote about in 2015, average deal sizes were being pulled up by a small group of extremely big funding rounds in later stage companies isolated to the Bay Area. So, what's happening here?
To first see how skewed the underlying deal sizes might be, I calculated the statistical dispersion (standard deviation) of round sizes annually for the various round sequences (I would have liked to use different measures, but am limited by what is possible in the Pitchbook platform). The data show that the variation in round sizes has increased dramatically in recent years.
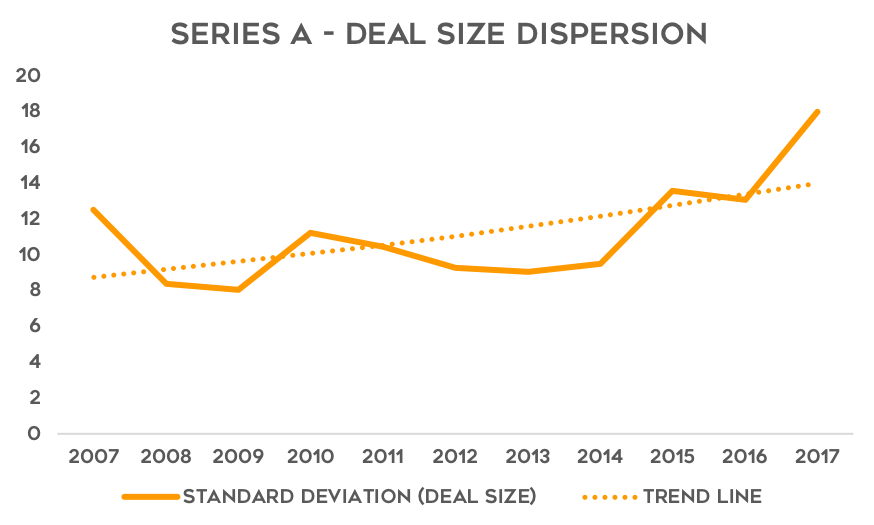
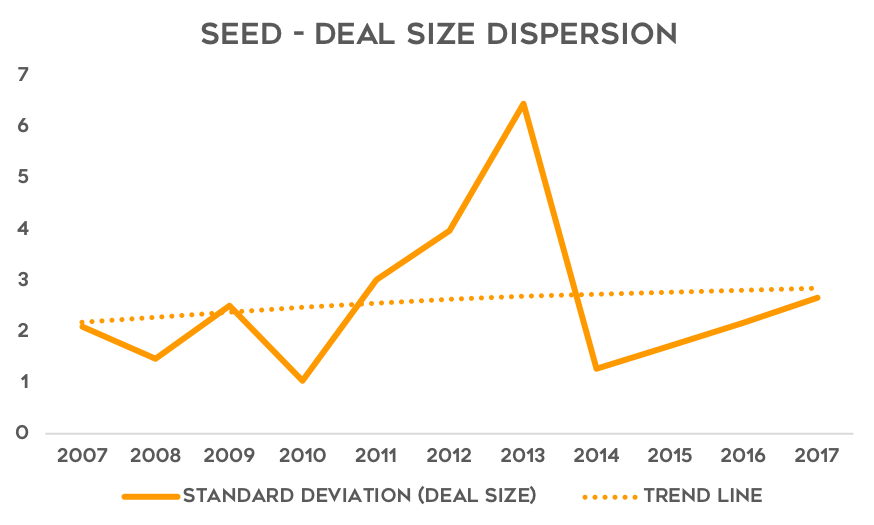
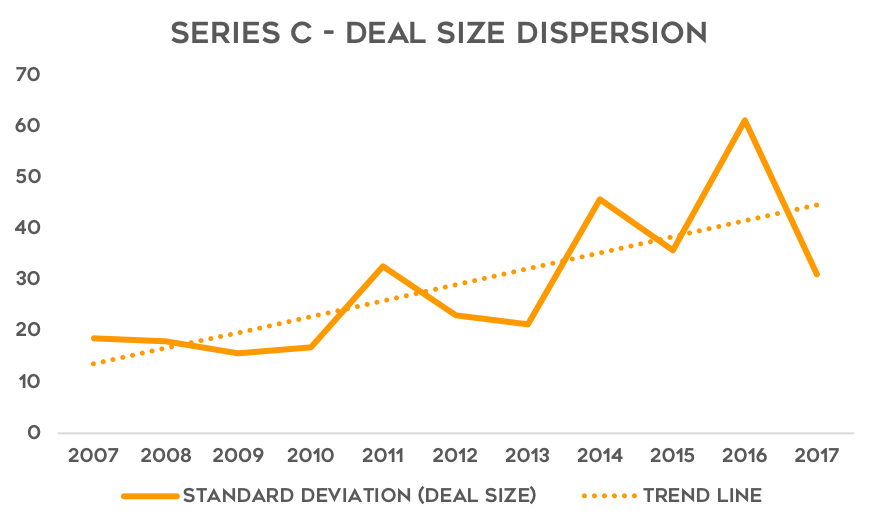
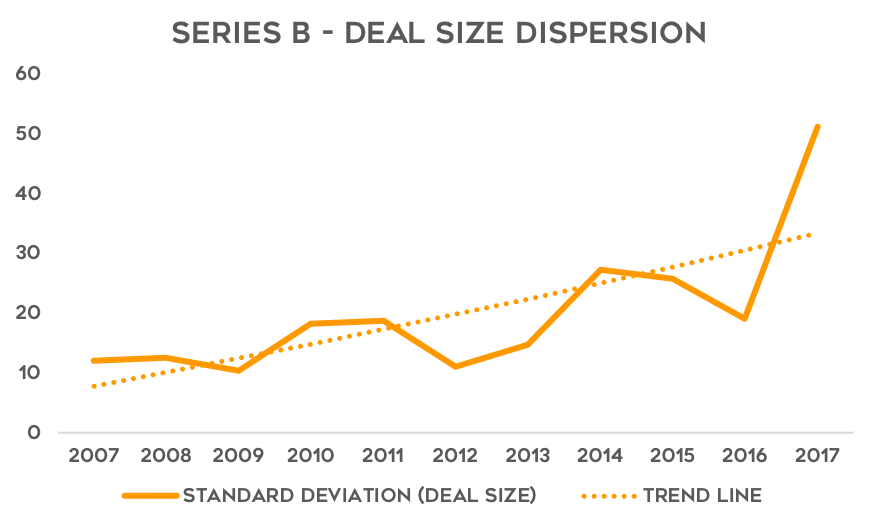
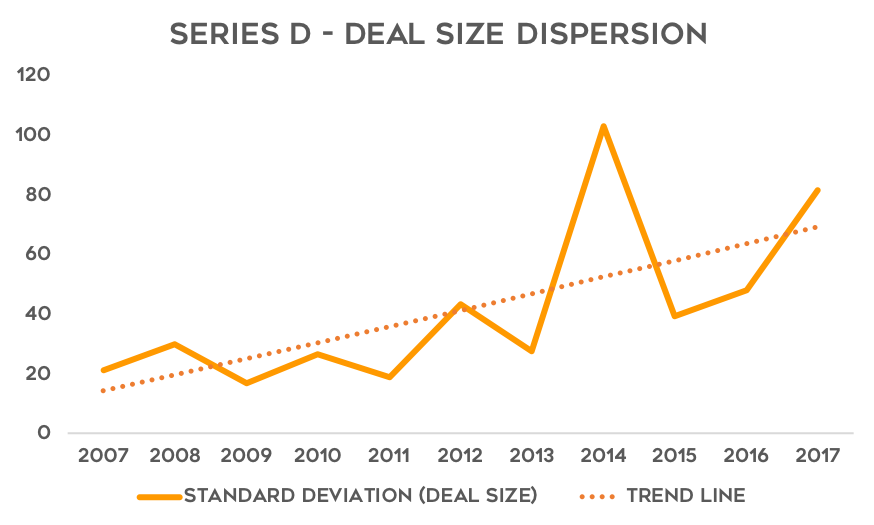
A standard deviation simply reduces the total variation in deal sizes to a single number, but it doesn't tell us where that variation is coming from. Its movement up to the right only tells us that the variation across deal sizes overall is increasing.
To go deeper, I dug into actual deal size distributions. The statistical measures included are the mean, and the 25th, 50th (median), and 75th percentiles.
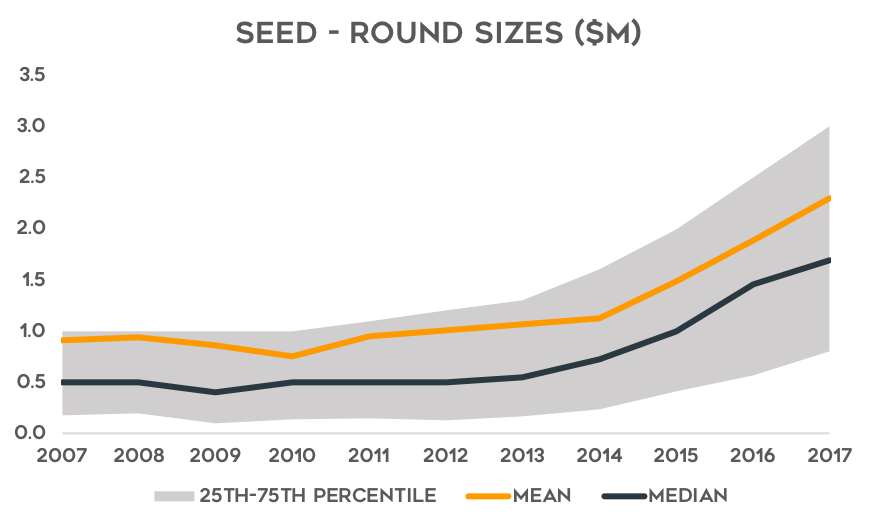
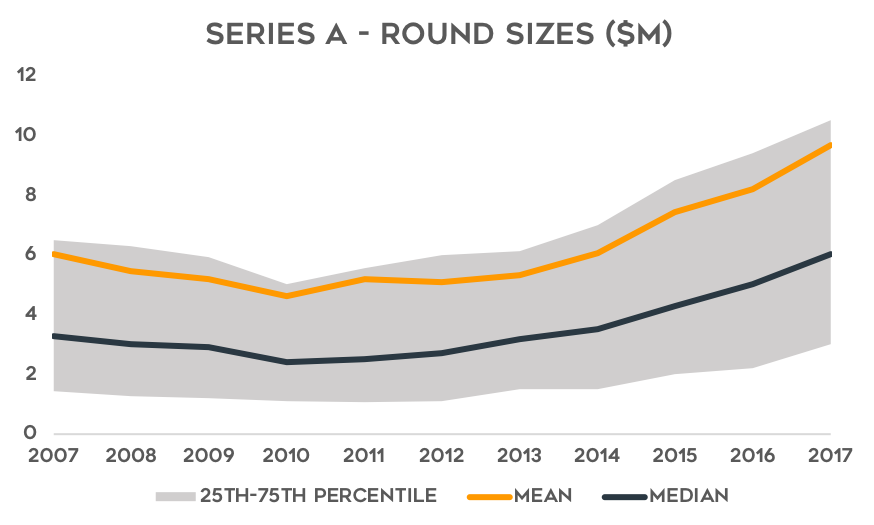
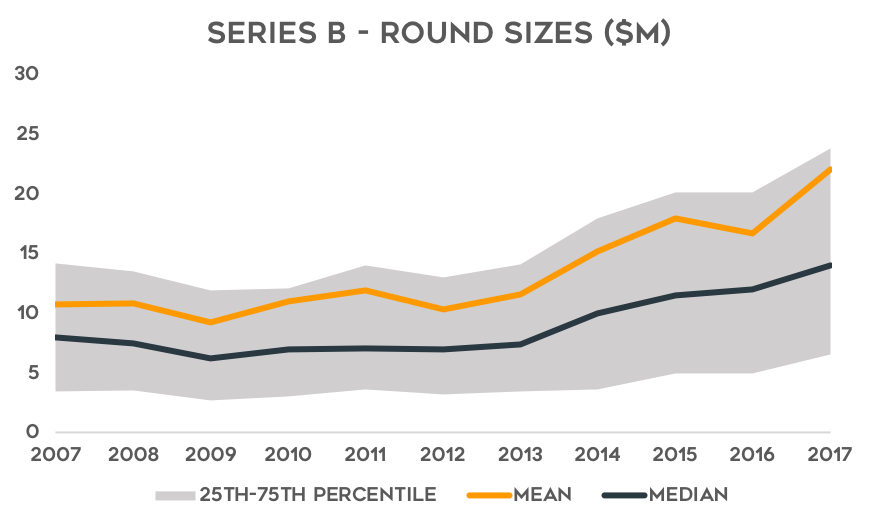
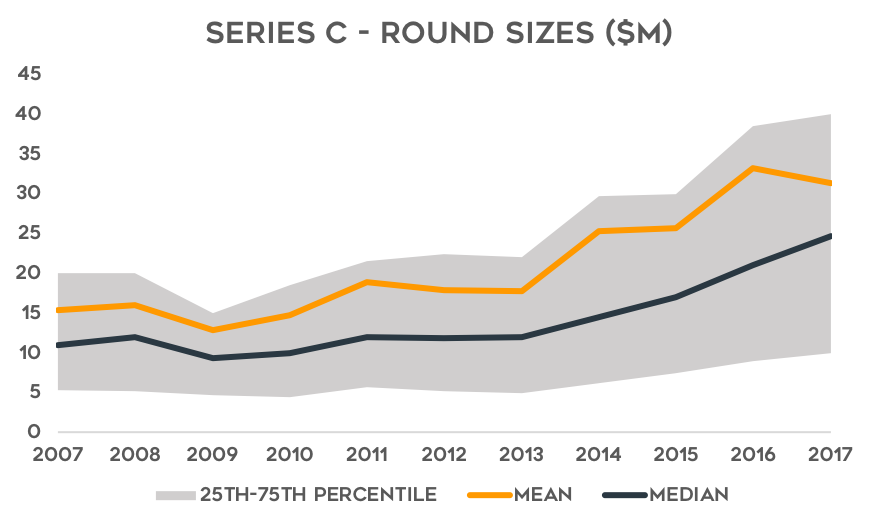
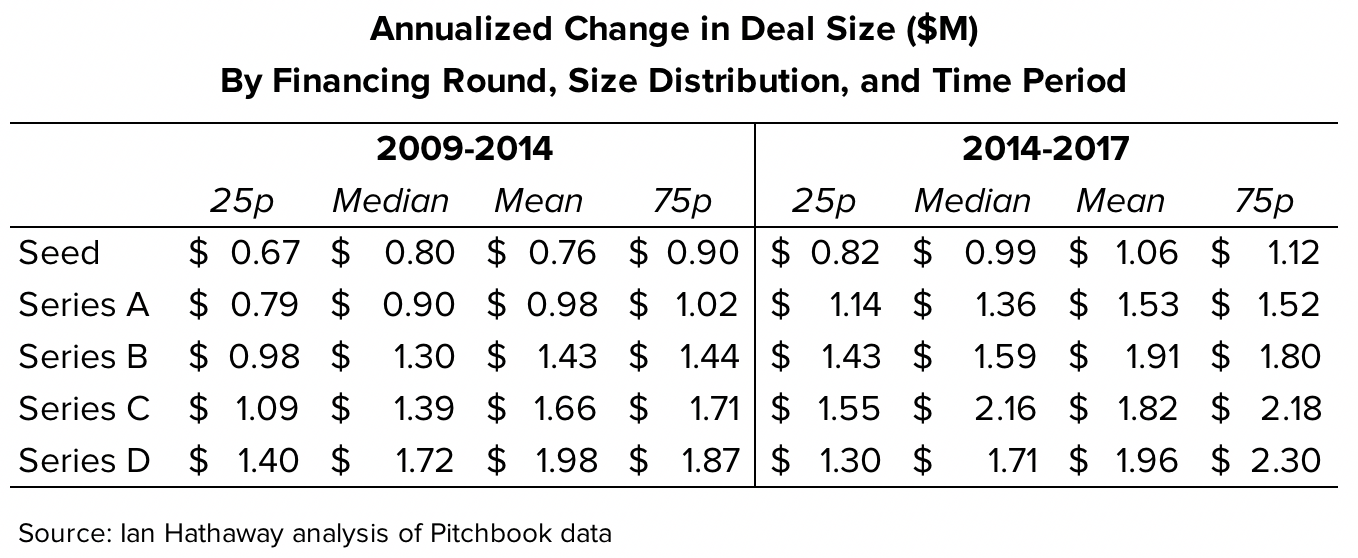
There is a lot going on here, so let me try to simplify. To begin, deal sizes across the distribution are up pretty much universally since around 2014 where there is a marked kink in the lines. What the table shows is that the annual deal size increases between 2014 and 2017 were larger (in absolute terms) than in the 2009 to 2014 period. So, deal sizes at each distribution are larger, are collectively pushing up the average, and those increases have been bigger in recent years than earlier in the decade.
What you can't see (unless you're a math wizard), is that what's pushing up deal sizes for Seed and Series A deals in a relative sense is a increases in deal size above the 75th percentile. This is due to a mean that is increasing at a faster pace than everything else (it's being pulled up by the largest deals that aren't plotted here). For Series B it's a tightening of the distribution from the bottom that is at work (the mean is pushed up by relatively bigger deals at the bottom), while for Series C it's a shift upward for the entire top half of the distribution (the mean, median, and 75th percentile are pulling away from the bottom half). Finally, for Series D, there is a bifurcation—smaller deals are getting smaller, bigger deals are getting bigger.
So, going back to the original motivation for this post, to dig deeper on Seth's data that shows average early stage deals getting bigger, my analysis would add a wrinkle to that—all of Series A deals across the size distribution are getting bigger, but there are some really big ones that are pulling up that average even more. The same with Seed deals.
I took a look to see some of the biggest deals in 2017 in these two stages. Sure enough, there were some really big deals. One company, Chicago-based Outcome Health, raised more than $500 million in its Series A. Seven additional companies raised more than $100 million and another 21 companies raised more than $50 million. Compare that to 2014 when only two companies raised Series A rounds above $100 million and just 15 raised rounds above $50 million. These outliers aren't driving the entire trend, but it's a big part of the story to be sure.
To wrap this up, here are my main takeaways:
- The well known trend in venture capital—of declining deals and yet increasing capital invested for larger average deal sizes—is established here, and shown to be spread across the round sequences from Seed through Series D.
- Deal sizes are increasing not only across the round sequences (Seed, Series A-D), but also across the various size distributions within the round sequences (mean, median, 25p and 75p).
- A widening statistical dispersion of deal sizes indicates that looking at the averages alone misses some key details on what's driving the trend—that some parts of the within-sequence distribution are increasing in size more rapidly than others.
- At the Seed and Series A rounds, it appears that the average deal size increases are being driven at the very top—there are some extremely large deal sizes in those rounds in 2017, and a critical mass of deals above $20 million and $50 million.
- At Series B and Series C, round sizes are also increasing across the distribution, but in the case of the former the increasing average is disproportionately being driven by the bottom, where in the case of the latter, the top half of deal sizes overall is pushing up the average.
- Deals at Series D are exhibiting a bifurcation—smaller deals are getting smaller, and bigger deals are getting bigger.